
参考资料:https://blog.csdn.net/qq_36787243/article/details/119906754
一、作用说明
先来简单介绍一下:node_exporter、Prometheus 及 Grafana 的作用:

※ node_exporter:收集服务器资源相关数据。
※ Prometheus:用于储存及收集数据。
※ Grafana:展示数据。
二、部署 node_exporter
下载部署命令:
1 | cd /usr/local/src/ |
服务器下载太慢时,可以直接从 GitHub 网站下载,并将压缩包上传至服务器。
1 | tar -zxvf node_exporter-1.2.2.linux-amd64.tar.gz -C /usr/local/ |
启动 node_exporter 命令:
1 | nohup /usr/local/node_exporter/node_exporter & |
验证访问:
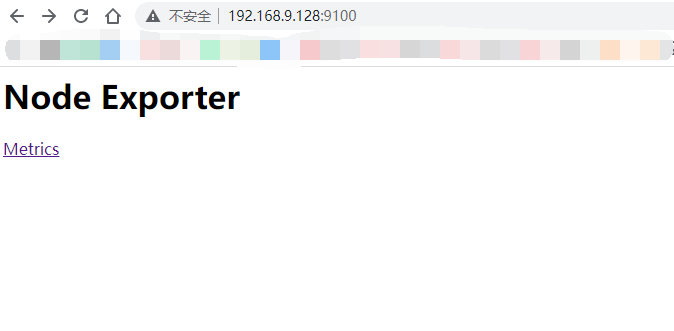
访问 http://192.168.9.128:9100,这里的 IP 替换为服务器 IP 。
出现以下页面说明启动成功:
三、部署 Prometheus
下载部署命令:
1 | cd /usr/local/src/ |
修改配置文件:
vim prometheus.yml
修改成当前服务器的 IP :
启动 prometheus 命令****:
1 | nohup /usr/local/prometheus/prometheus --config.file=/usr/local/prometheus/prometheus.yml --storage.tsdb.path=/var/lib/prometheus & |
验证访问:
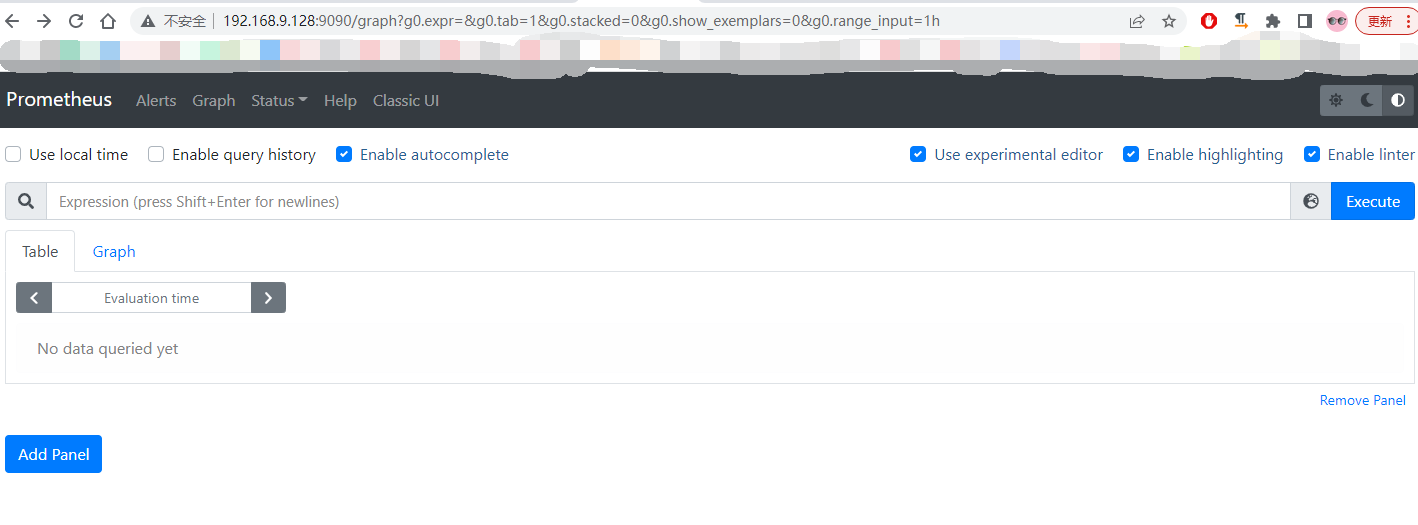
访问 http://192.168.9.128:9090,这里的 IP 替换为服务器 IP 。
出现以下页面说明启动成功:

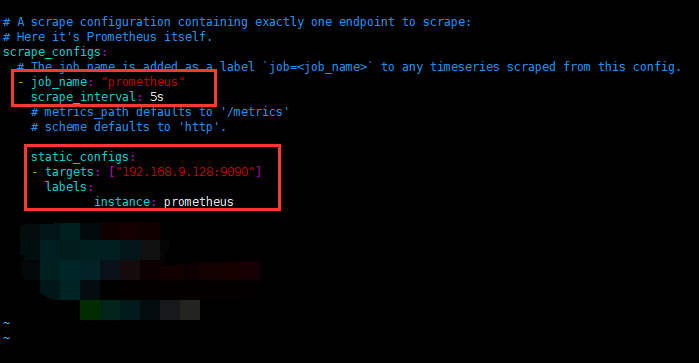
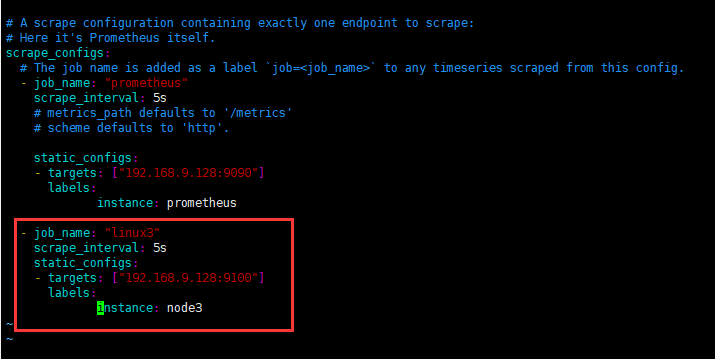
修改配置文件:
默认 prometheus 接收 node_exporter 采集的数据,再次修改 prometheus 配置文件,重新启动 prometheus 。
vim prometheus.yml
1 | netstat -anput |
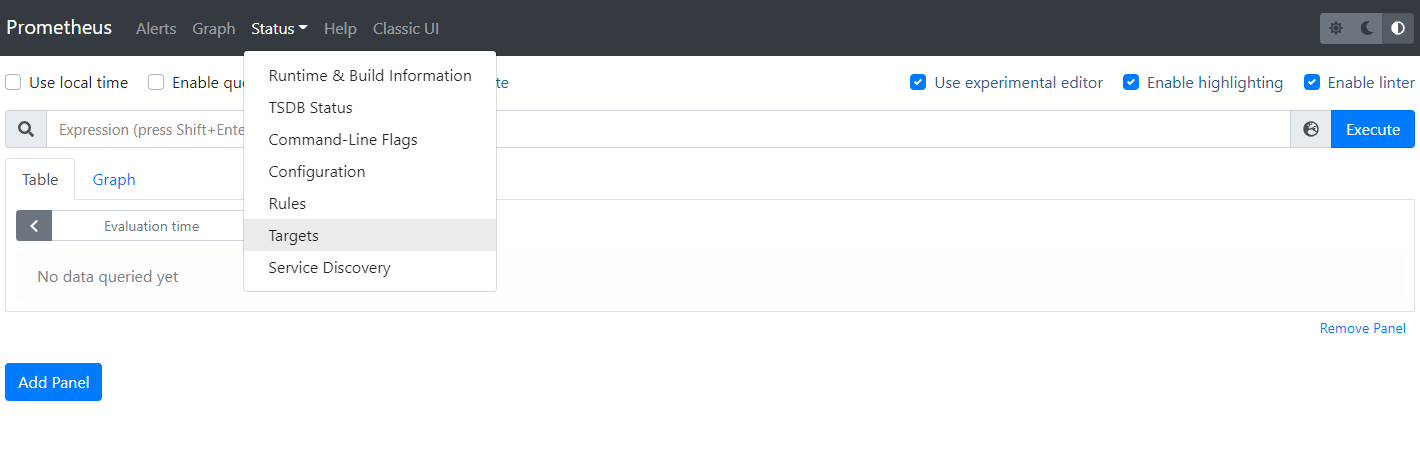
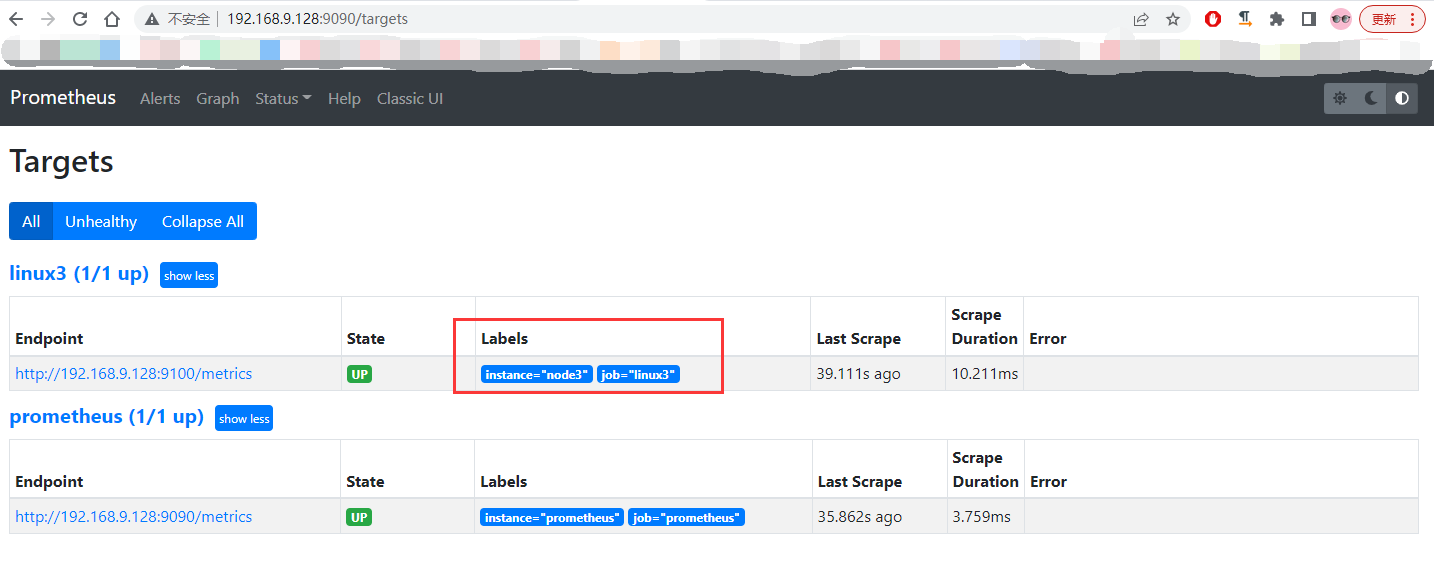
重启后验证访问:
访问:http://192.168.9.128:9090/targets
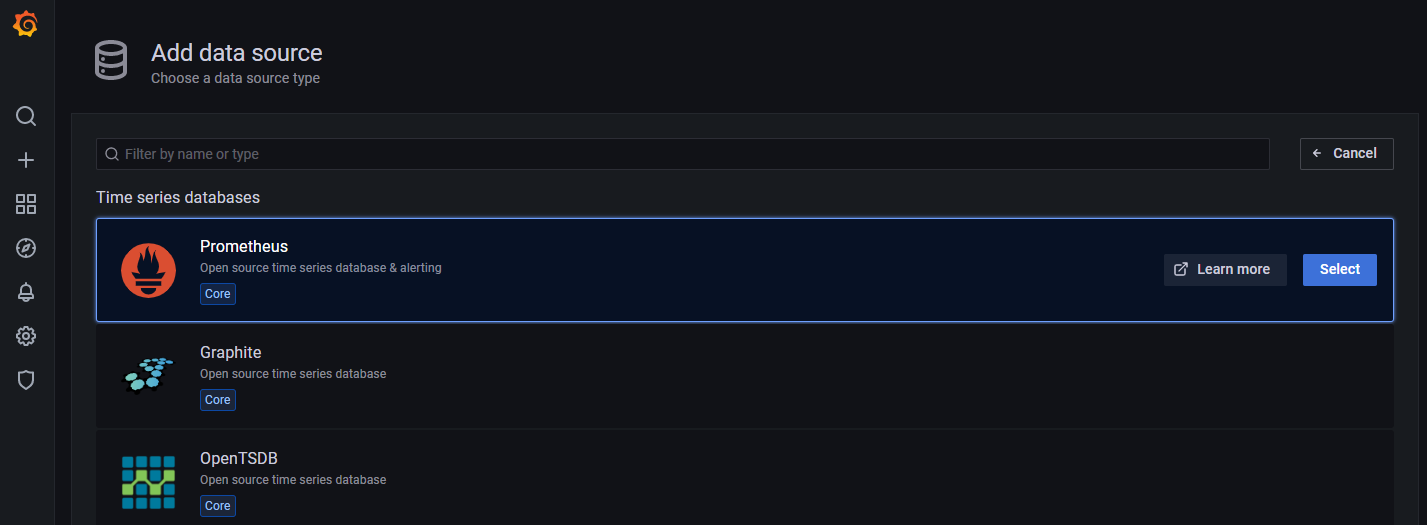
四、部署 Grafana
下载部署命令:
1 | cd /usr/local/src/ |
配置文件
配置文件位于 /etc/grafana/grafana.ini ,这里暂时保持默认配置即可。
开机自启动
1 | systemctl enable grafana-server |
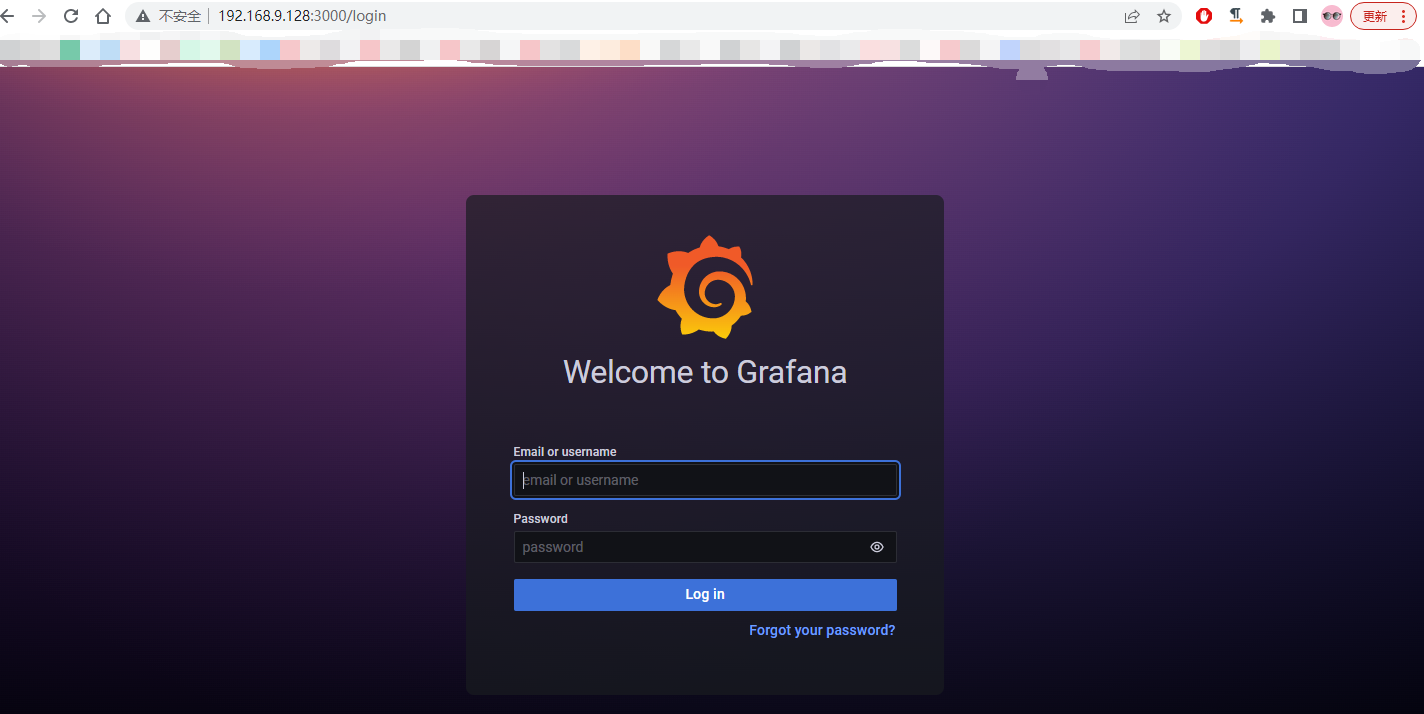
验证访问
访问 http://192.168.9.128:3000,这里的 IP 替换为服务器 IP 。
默认账号名/密码:admin/admin。(首次登录会修改密码)
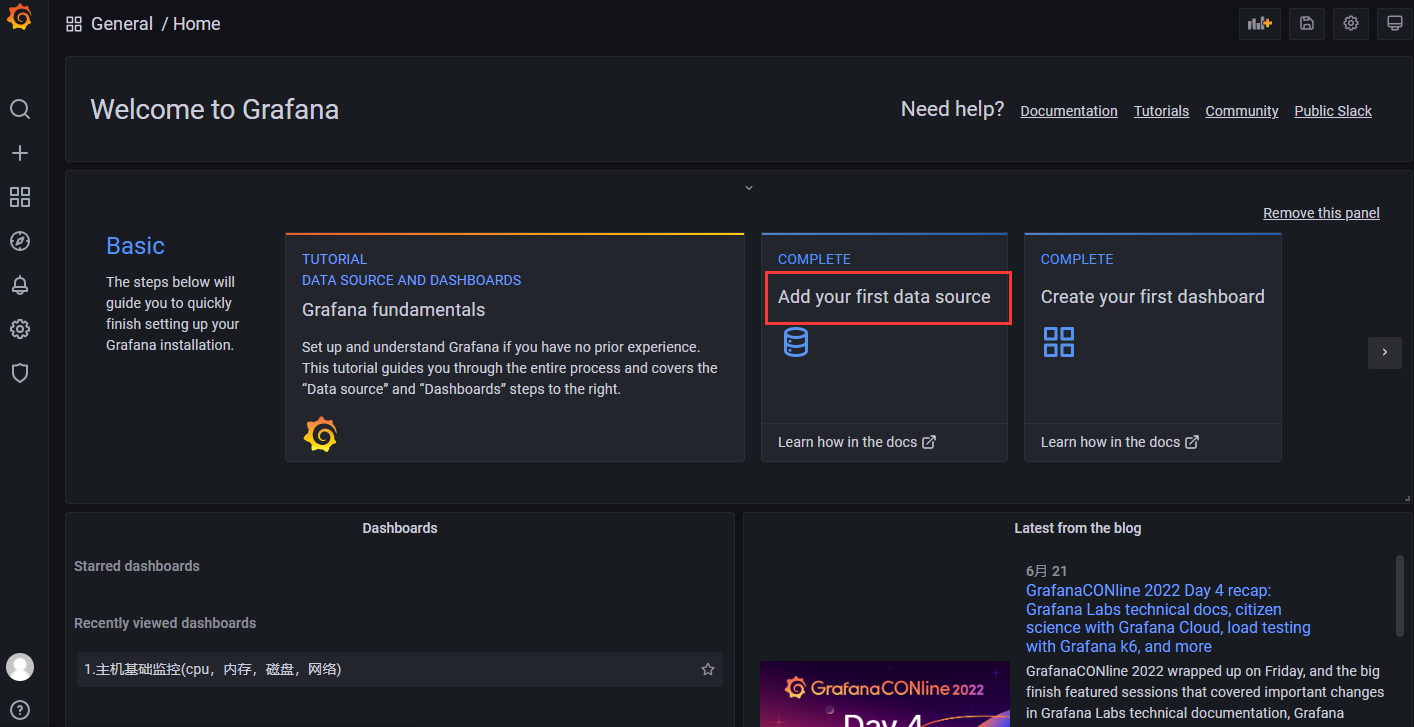
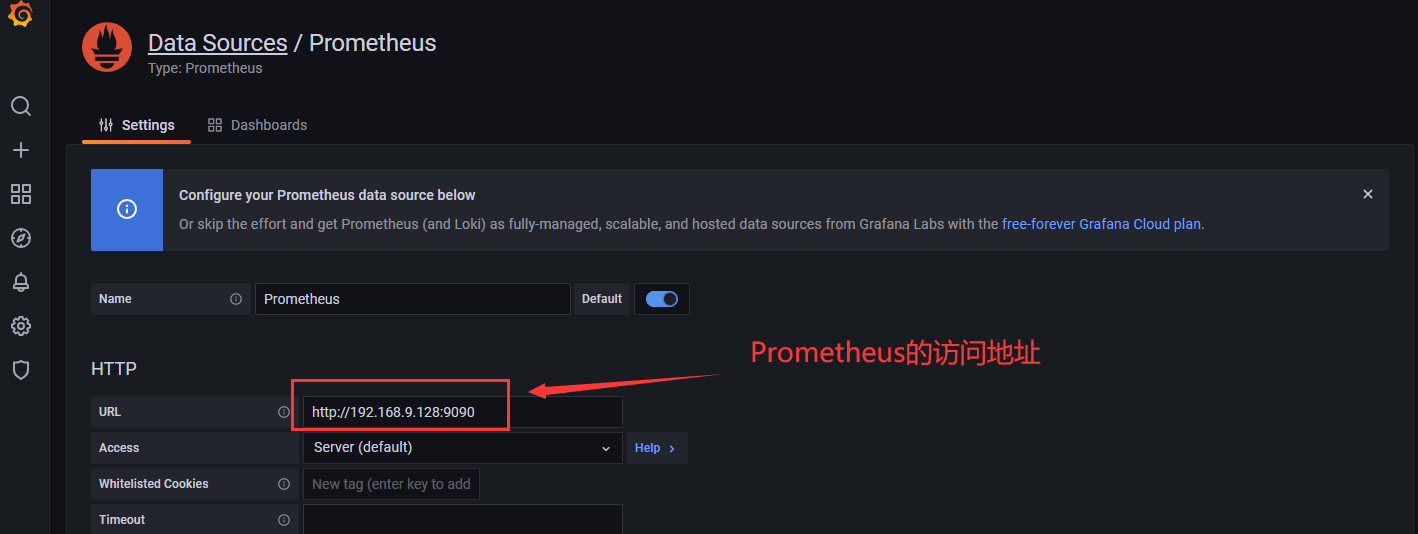
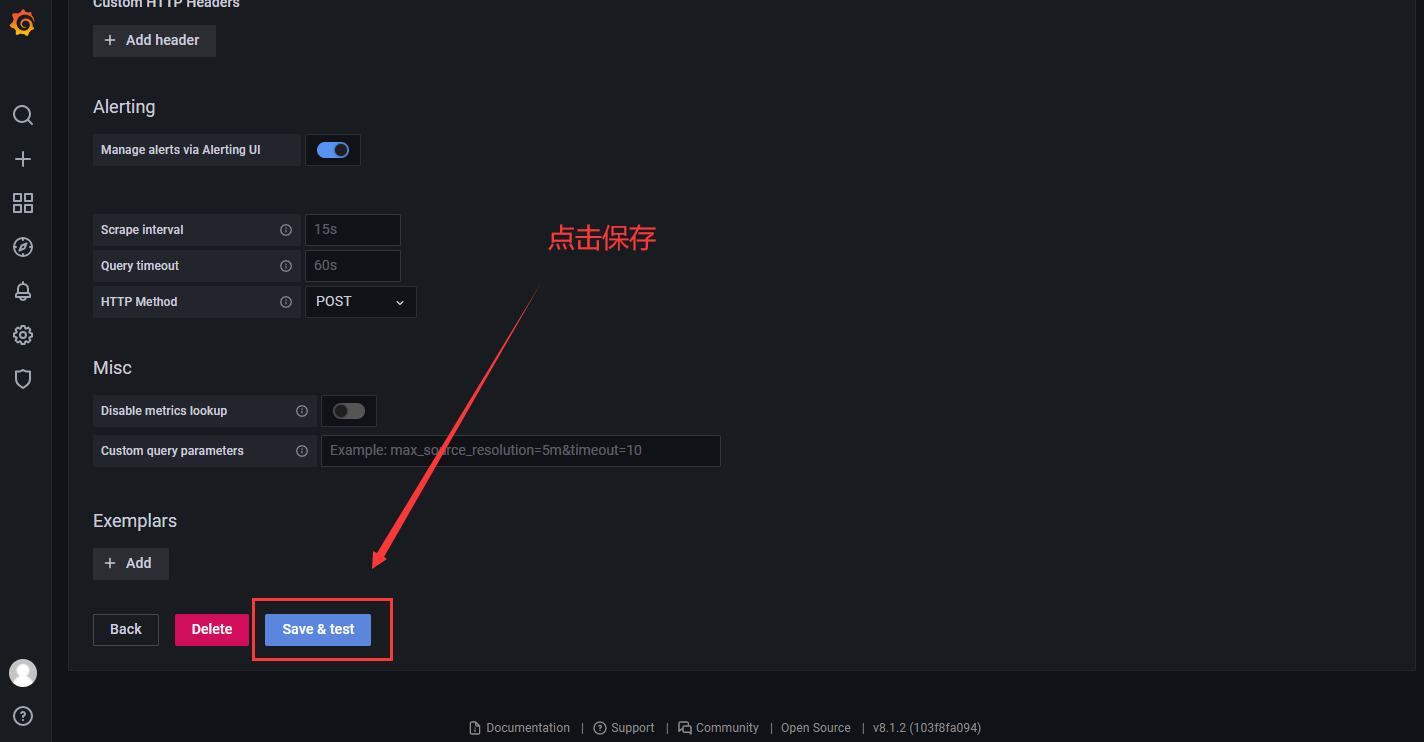
点击“Save&test”,出现“Data source is working”,代表数据源配置成功。
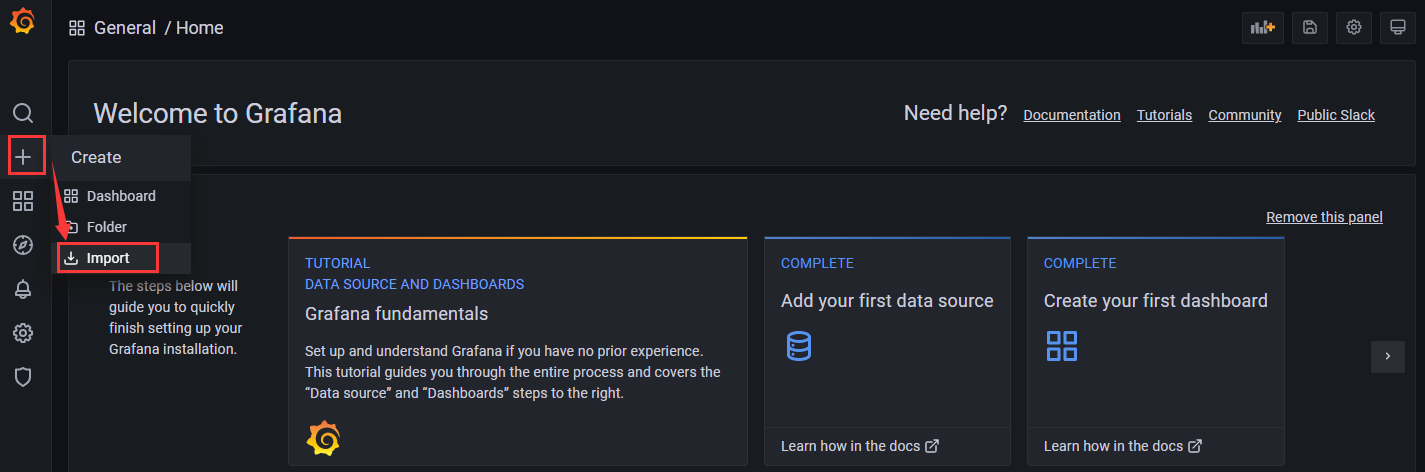
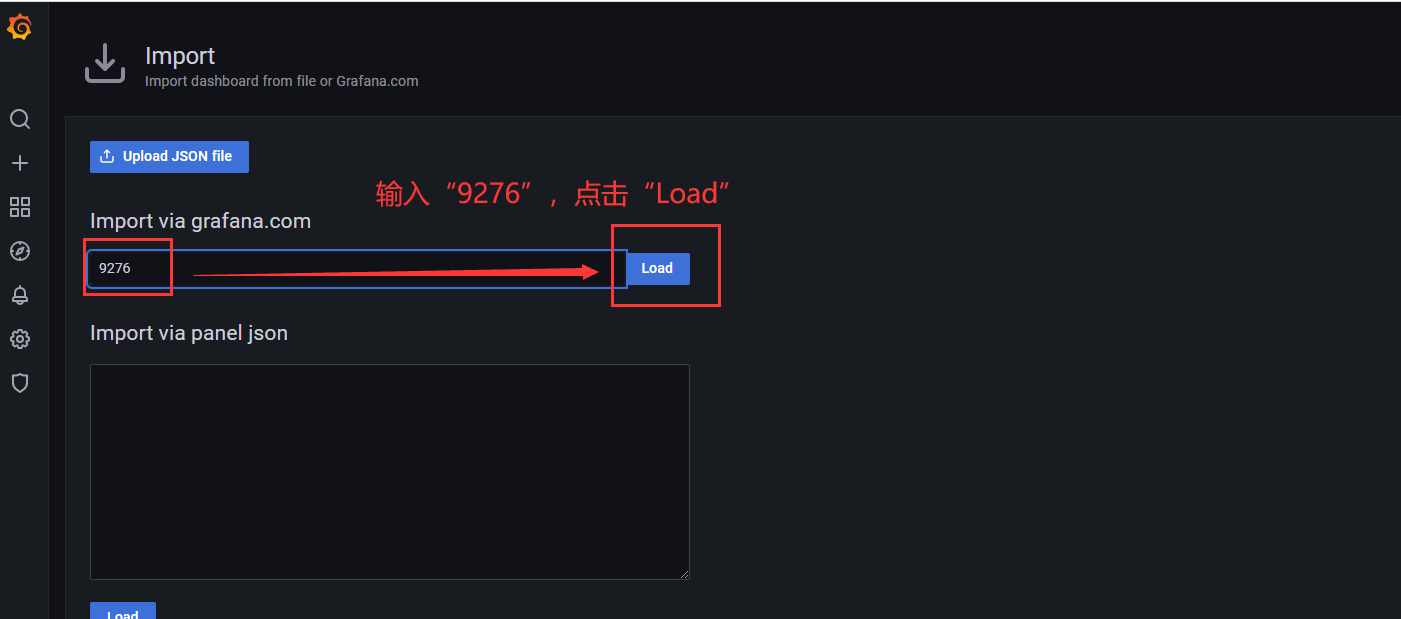
输入 ID :9276,点击 “Load”。( 9276 是比较经典好用的一个展示服务器资源使用情况的模板,这里以导入这个模板为例)
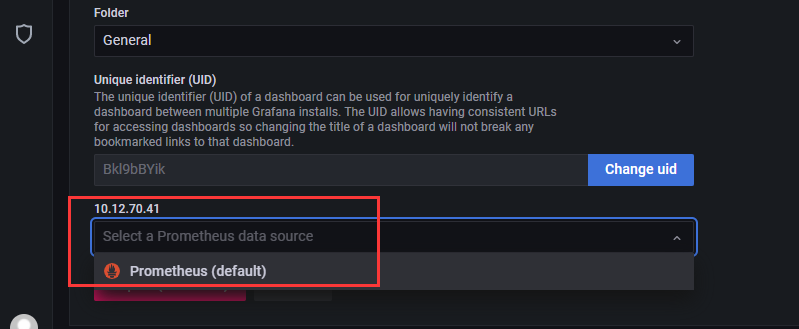
选择 data source,下拉选择上一步配置的数据源,点击 “Import”:
五、搭建总结
搭建过程中会遇到一些问题,不必惊慌。仔细查看搭建步骤,若出现不能正常访问界面的情况。可尝试进行直接启动,查看启动信息中 error 信息。配置文件对格式要求严格,请修改配置时注意,空格,标点符号采用英文形式。
 Autumn